Wireshark is an amazing tool. While most people use Wireshark as a traffic capturing, and protocol analysis tool, it can do a lot more than that. In this blog post, we will walk through the steps of analyzing a multi-stage attack pcap file using Wireshark alone.
Go ahead and download Wireshark if you haven’t yet, and download the pcap file that we will use in this analysis. Once downloaded, unzip the file and open it in Wireshark.
- The file has more than 103,000 packets. Therefore, we cannot examine all of them one by one. So, where do we start?
- The first step is to look at the protocol hierarchy. Click on “Statistics” from the top menu, and then “Protocol Hierarchy”.
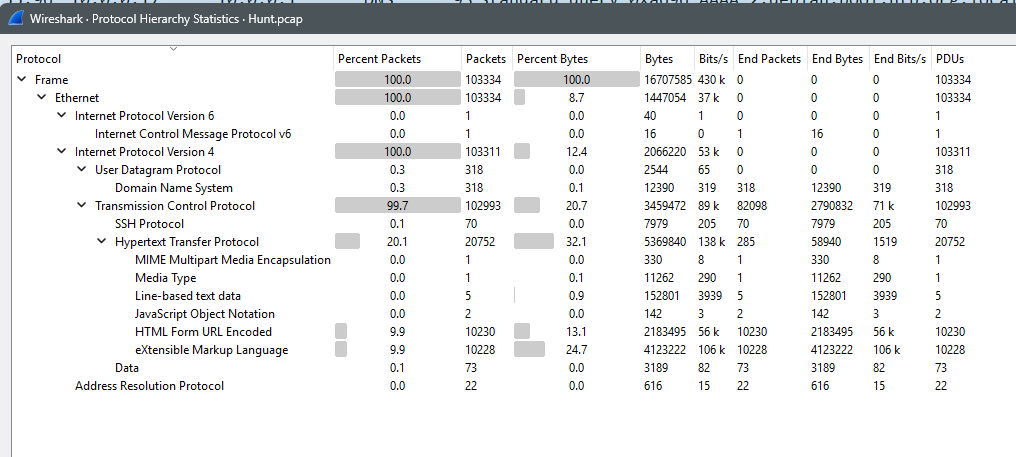
- You can see that there is one ICMPv6 packet, which makes it unlikely to be the attack vector.
- You can see there are 318 DNS packets, which makes it less likely that this is the attack vector. Therefore, we exclude DNS. Remember that DNS can also be abused, but in this context it is less likely, and therefore, we’re not inspecting it first.
- The 22 ARP packets also are highly unlikely to be attack vectors. Most ARP attacks involve flooding (not all of them).
- The most likely vector is HTTP because it is about 20% of the traffic, and then XML being 10%.
- Close the statistics, and filter out ARP and DNS traffic using “!dns && !arp”
- Next, try to locate the SSH traffic that we saw in the statistics. Add “&& ssh” to the filter, and you’ll notice that the SSH traffic is close to the end of the attack. Which means that the attacker probably gained access to SSH after succeeding in the first steps.
- Therefore, we’ll leave SSH to the end. In general, there isn’t much that we can do since it is encrypted traffic. Remove the “&& ssh” from the filter.
- By scrolling thought the remaining packets from the top, you will notice a large number of “HEAD” HTTP requests. What is HEAD used for?
- This technique is used by attackers to enumerate files and folders by attempting common file names from a dictionary to see if any of these files exist and is accessible publicly. Mostly, the attacker tries to find any sensitive files that might contain passwords such as the database password, for example. Let’s filter to see these HEAD commands by adding the following to the existing filters && http.request.method == “HEAD”
- Now, you’ll see that there are 137 of these requests. Which is not a usual number from a non-malicious actor. If you examine the responses to these requests, they’re all 404.
- This can be considered the first step of the attack “File enumeration”. In this steps, the attacker is looking for sensitive files, such as wp-config.php, that have misconfigured permissions. If you look closer at the names of the files you’ll see that the attacker is trying to find a misconfigured file containing sensitive information such as the database username and password, which is usually stored in wp-config.php or backups of this file.
- Another malicious indicator is the user-agent of the client request in these HEAD packets. This step ends at packet 326.
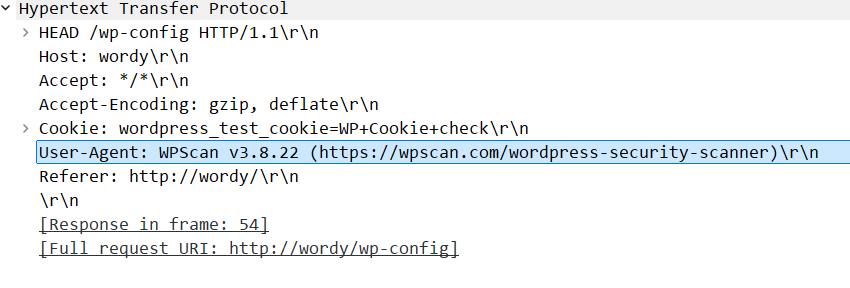
- This user agent is a well-known open-source offensive tool used to attack WordPress based websites.
- Now, we move on with our analysis from packet 327 onwards.
- The attacker tried to find if the website (now we know it is a WordPress website) supports the method called “wp.getUsersBlogs” using the XMLRPC API in the website. The website responds with 200, which means it is supported.
- XMLRPC in WordPress is a backend method to access the website and connect it to mobile apps, or other websites.
- You can see from there the attacker trying to access this service with different usernames and passwords. To see how many attempts, you can add the following to the existing filter:
http.request.method == “POST” && http.request.uri == “/xmlrpc.php”
- You’ll see more than 10,000 attempts with varying usernames including (admin, jens, graham, mark, and sarah), and attempting different passwords for each of these users.
- This is clearly a dictionary attack (a type of brute-force). We can consider it the second stage of the attack.
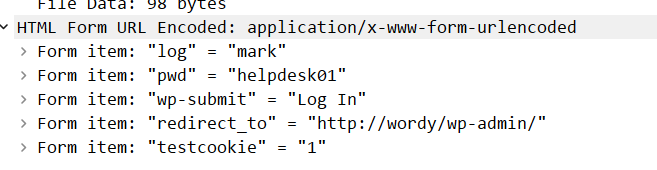
- If we remove the additional filter we added previously, and scroll down from the last XMLRPC call, you can see the attacker visiting the admin page “/wp-admin/” and successfully logging packets 102789 to 102811. Actually, you can see the POST command in packet 102807 showing the username and password that the attacker successfully grabbed (mark, helpdesk01).
- If you scroll down a few packets, to explore what the attacker did after login, you’ll see that they accessed a WordPress plugin called Plainview Activity Monitor.
- Conduct a simple search online, and you’ll see that the plugin is actually vulnerable to a dangerous remote OS command injection vulnerability.
- If you scroll down more, you’ll see the attacker exploiting this vulnerability using a POST command in packet 102996. The content of the packet shows clearly that the attacker created a reverse shell back to the attackers machine on port 9999. This looks very similar to the proof-of-concept code in the vulnerability exploit.
- Now you can scroll down to see the reverse shell session going to port 9999 at the attacker’s machine. Right click on the first packet in the session and select “Follow” and then “TCP Session”. Now, you’ll see the whole exchange and everything the attacker did on the machine.
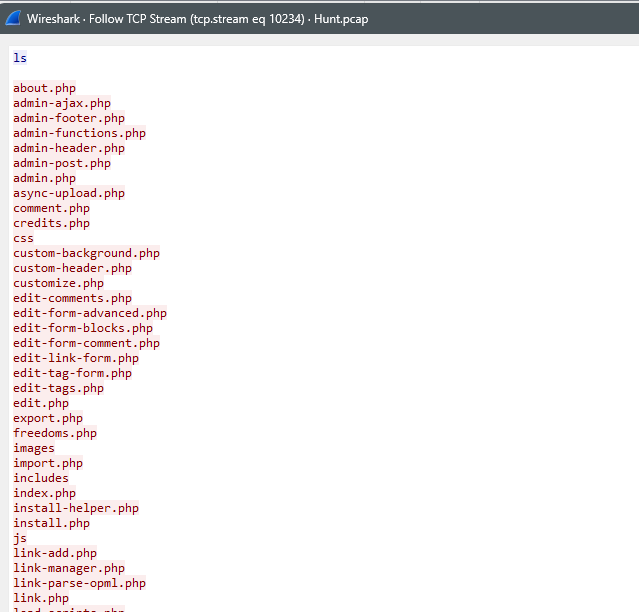
- Reading through the session, you can see what the attacker did. What information did they get?
- The username and password the attacker found on Mark’s desktop are probably the ones used to setup the SSH session. Mark is definitely going to be fired after this.
- This concludes the third phase of the attack.
There isn’t much that we can do afterwards, because the SSH session is encrypted, and the attacker disconnected the reverse shell session. If we want to inspect this further, we would probably need access to some logs such as auth.log, and perhaps a command line log to see what the attacker did in the SSH session.